
The Physics of the Option Surface: Understanding Stretch Magnitude and Skew Momentum
A deep dive into technical terminal telemetry. Learn how Gammatic extracts order flow anomalies using proprietary metrics like Stretch Magnitude (σ-deviations), Atmo Pressure, and Skew Momentum relative to institutional market-maker positioning.
Research

Executive Summary
Price action is merely a lagging shadow cast by institutional capital flow. To locate true structural extremes, quantitative operators must measure the physical distortion of the options surface. This article explains the underlying mathematics behind Gammatic’s core terminal telemetry: Stretch Magnitude, Atmo Pressure, and Skew Momentum—the structural metrics required to map market geometry accurately.
The Myth of Price-Based Overbought/Oversold Tiers
The retail trading consensus relies heavily on static price levels to identify market extremes—labeling an asset "overbought" when an indicator passes an arbitrary numerical threshold. This methodology completely ignores institutional liquidity dynamics. An index can remain statistically extended for weeks if massive block-order inflows continually absorb the available floating supply.
True market boundaries are determined by options surface gravity. When institutional desks buy massive volumes of protective puts or yield-generating calls, they physically warp the implied volatility surface. If the underlying price is pushed violently away from the core distribution of institutional open interest, it creates an unsustainable structural tension. Quantitative trading relies on measuring this tension precisely, treating price action as a compressed spring that must eventually release.
Quantifying Structural Deviations via Stretch Magnitude
Gammatic replaces conventional overbought/oversold indicators with Stretch Magnitude, a proprietary metric calculated in standard deviations. Stretch Magnitude isolates the underlying asset's current spot price and measures its distance relative to the historical volatility boundary of the options surface chain.
When the terminal displays a Stretch Magnitude of $+6.32σ, it indicates an extreme statistical outlier. This means the underlying asset has been driven to a localized horizon where the cost of maintaining short-term option positions becomes unsustainably expensive for market makers. Combined with our Reversion Probability algorithm, Stretch Magnitude allows operators to view the exact math of a localized exhaustion point, preventing them from chasing overextended momentum right before a structural reversal occurs.
Operational Telemetry: Atmo Pressure and Skew Momentum
To provide a complete three-dimensional view of market mechanics, the Gammatic terminal pairs Stretch Magnitude with two complementary telemetry streams:
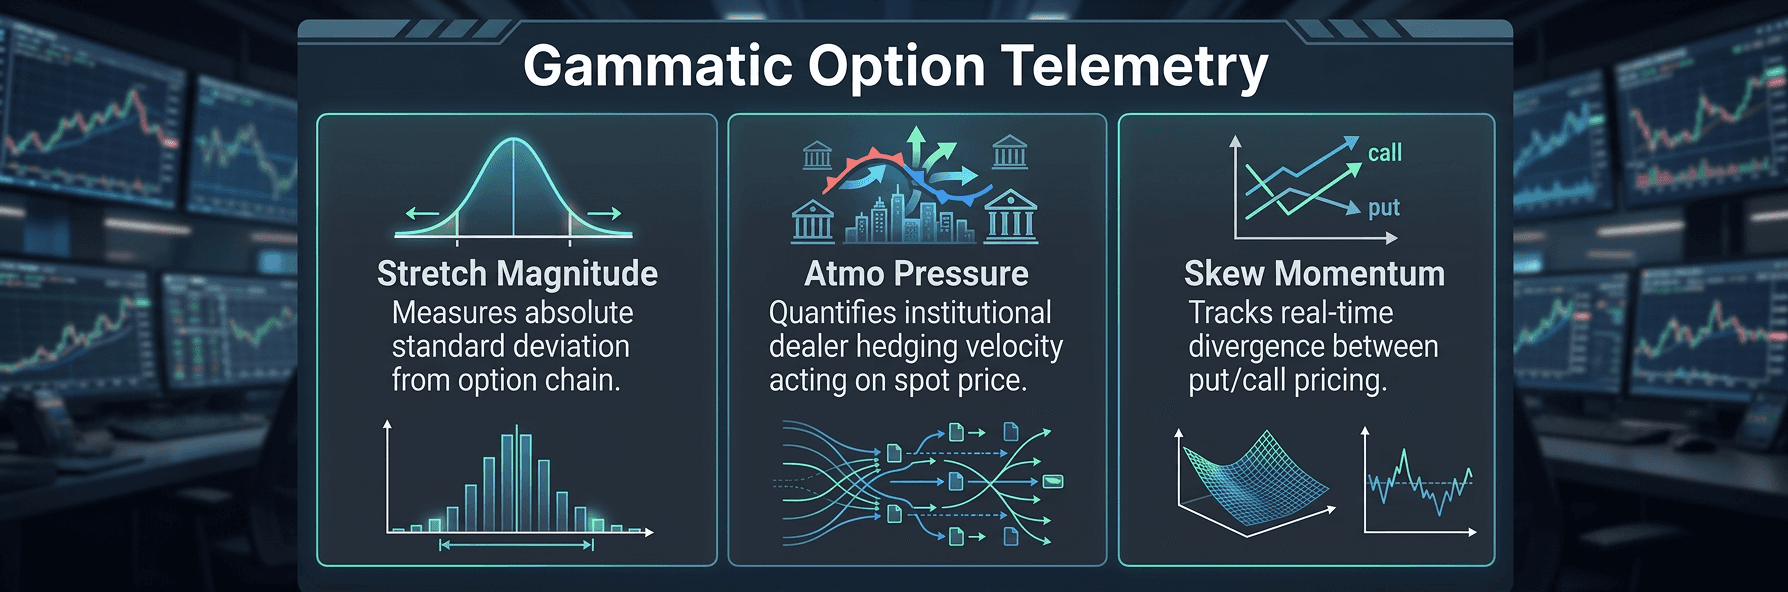
Atmo Pressure (Atmospheric Hedging Pressure): This metric quantifies the total volume of dealer rehedging orders waiting to hit the market. If Atmo Pressure is extreme, it warns the operator that a minor move in the underlying price will trigger a violent, automated cascade of market-maker buying or selling, dramatically increasing local volatility.
Skew Momentum: Options skew measures the premium difference between out-of-the-money puts and calls. Skew Momentum tracks the rate of change of this skew vector. If an index is rising, but Skew Momentum is shifts aggressively toward put pricing, it signals that institutional players are aggressively buying downstream insurance despite the upward price action—revealing a hidden bearish distribution hiding behind a bullish chart.
By integrating Stretch Magnitude, Atmo Pressure, and Skew Momentum into a single, cohesive view across the Sector Regime Map, terminal operators gain an uncompromised mathematical cockpit. They no longer guess where support and resistance hide; they see the exact coordinates where institutional options physics forces the market to stall or accelerate.